The Immunological Synapse (IS)
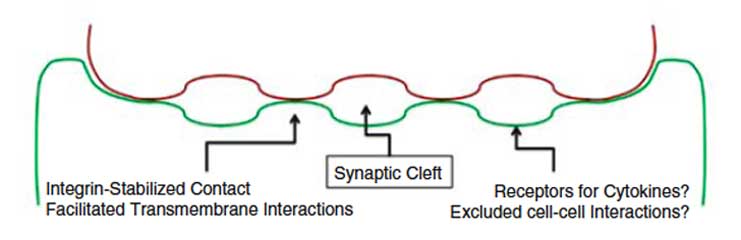
The immunological synapse is a junction that forms between T cells and specialized cells that present fragments of foreign or self-derived material (‘antigens’) in a specific surface molecules called MHC . The junction between T cells and these antigen-presenting cells (APC) is characterized by close membrane appositions, separated from one another by ‘synaptic’ regions. Signaling occurs when a complex of proteins on T cells called the T cell receptor (TCR), in association with CD3 and CD4 transmembrane proteins, bind to the peptide/MHC complexes. Other receptor-ligand pairs, such as CD28-B7 and CD40L-CD40 also accumulate at this interface. There are also synapses formed between T cells and other T cells as well as between natural killer cells and dendritic cells. Consecutive synapses formed between members of the immune system likely give rise to the specificity of the immune response and allow individual cells to ultimately make a ‘collective’ response (see ‘Immune Collectives’ movies). Below, we highlight some of our current understanding of these structures including the formation of TCR clusters in the contacts and the aggregation of these into a highly enriched central supramolecular activating cluster (cSMAC).

How do T cells ‘taste’ their environment? T cells use tiny finger-like projections, called microvilli, to sample their environment. Using a very fast and high-resolution microscope, we’ve been able to study how they wave these around to achieve high surface coverage. Details: Surface projection of an OT-I T cell labeled with anti-CD45-Alexa488 and imaged by LLS microscopy. Time resolution is 2.25 s. For this movie, the cell’s position in space was stabilized using the center of mass.

When we study these over time, we can see that even though those little finger-like projections may only touch a small fraction of a nearby object (shown as the red region in the ‘Threshold’ image in the bottom left), over time the movement of those microvilli means that they can ‘taste’ the entire object (Sum frames, in bottom right) Details: Time series movie of microvillar movement. Time resolution is 2.25 s. Top left: Maximal intensity projection of the cell surface. Top Right: selected region captured as a mask. Bottom left: application of a threshold to define instantaneous contacts. Bottom right: Logical OR movie of all time points up to and including the current, taken from the binary map of instantaneous contacts. Instantaneous and cumulative coverages were calculated from bottom left and bottom right results, respectively.

When T cells ‘find’ something on an opposing cell, the projections can become stabilized at “The immunological synapse formed between a T cell (red in top left image) and an antigen presenting cell (green spotted cell). Details: This movie shows an IS formed between a T cell and an APC captured by time-lapse LLS microscopy. For “synapse side view”, the T cell, labeled with anti-CD45-Alexa488, is shown in red; the APC (BMDC), labeled with DiD, is shown in green. The top-right panel shows the “en face” view of this synapse. The lower-left panel shows a 3D surface of the synapse rendered. The lower-right panel shows the synapse with the z scale (the distance that the projection sticks out) color coded.

This kind of stabilization, of the projections, can be dramatically seen when T cells have found a lot of material. Some of the projections (yellow) have lots of molecules called T cell receptors that help them to hold on. Others (red) do not and are dynamic, moving all around, presumably searching their environment . Overlay of the TCR+ contact population (shown in yellow) with the TCR- contact population (shown in red). Movie demonstrates the stability of the TCR+ compared to TCR- contacts.
T cell Receptor Dynamics
 T cell receptors (TCR) form clusters prior to signaling onset and aggregate these clusters into a cSMAC over time.
D10 T cells responding to APCs pulsed with 10mM CA 134-147. Each timepoint shows the DIC (top left), FURA ratio (color-coded blue-green-yellow-red-white, top right), mid-cell z-section of GFP (bottom left), and computer-generated GFP contact-region view obtained using a MaxIntensity method for projection (bottom right). Each second of movie time corresponds to 30 seconds of real-time and the conditions are as described for the text Figure 1. This timing represents the average dynamic under these conditions. From Krummel et al Science 2000.
 A "blinking" phenotype in which TCR clusters dramatically form and fall apart.
Calcium levels appear to rise in a similar pattern. CH27 APC were pulsed with 0.1mM CA 134-147. Each second of movie time corresponds to 15 seconds of real-time. This phenotype occurred with a low frequency and appears to represent weak extreme of signaling and receptor aggregation. From Krummel et al. Science 2000.
 A dynamically forming and dispersing accumulation of TCR occurs accompanying calcium signaling.
Each second of movie time corresponds to 15 seconds of real-time. In this couple, it is clear that the T cell engulfs and surrounds the APC with membrane and a central accumulation is initially formed after 15 frames. In addition, small intracellular concentrations of CD3z-GFP can be observed and appear to move toward the interface. In this instance a brief, probably antigen-independent, accumulation is also seen at the front edge at frame number 6. From Krummel et al. Science 2000.
 Radial motion of T cell receptors in a highly stable IS.
T cells bearing OT-I or OT-I–GFP TCRs were imaged by TIRF during their interaction with lipid bilayers seeded with pMHC and integrin ligands.Highly symmetrical synapses result in which radial transport of T cell recpeptors is evident. Naïve wt OT-I or OT-I–GFP T cells were surface labeled with anti-TCRb antibody, placed on a lipid bilayer presenting pMHC and ICAM-1, and imaged by TIRF microscopy. Representative images show surface expressed TCRb (red) and OT-I–GFP fluorescence (green). Elapsed time is displayed in min:sec. From Friedman et al. JEM 2010.
Dynamics of Other Receptors in the IS
 Accumulation, followed by exclusion, of the CD4 co-receptor.
D10 T cells transfected with CD4-GFP were imaged while interacting with strong-agonist (10mM)-pulsed CH27 cells. Each second of movie time corresponds to 30 seconds of real-time. Typical accumulations in the interface were only approximately 2-fold higher than average cell-membrane intensities (see Web 4A). Note the initial central distribution of CD4 followed by the subsequent accumulated-exclusion phenotype. From Krummel et al Science 2000.
 Rapid recruitment of CD28 to T cell-B cell synapses.
The costimulatory receptor, CD28, was labeled with GFP and tracked during T cell activation. Peptide pulsed CH27 B cells were added to CD28-GFP D10s loaded with the calcium dye Fura-2. Cells were imaged every 30 seconds for 30 minutes. DIC images in the upper left quadrant are used to follow the cells visually. The Fura ratio of 340/380 displayed in the upper right quadrant is used to determine the intracellular free calcium levels. The lower left quadrant shows the maximum intensity of GFP through all planes. From Andres et al. JI 2004.
 Recruitment of CD40 to T-B cell synapses. To track the localization of CD40L-CD40 complexes in the IS, CD40 was labeled in B cells via a CD40-GFP fusion.
Time-lapse movies of CD40 aggregation on agonist antigen-bearing B cells following synapse formation, as evidenced by CD3 recruitment or calcium flux. Wild-type fura-loaded D10 T were mixed with CH27-CD40YFP B cells pulsed with agonist. At 30-second intervals, images were acquired from which a contrast image, a calcium ratio or CD3zCFP image, a CD40YFP image at mid-z-plane, with or without a reconstruction of the interfacial region are shown. Movie (A) demonstrates capping of CD40 followed by rapid loss of CD40 from the interface region. From Boisvert et al. JI 2004.
Flexibility of T-APC Synapse Structures and Motile Synapses:
Numerous studies from our lab and others has led to a stylized understanding of synapse dynamics, best characterized by the movies shown in ‘Radial motion of T cell receptors…’ above. However, ongoing work shows that T cells can flexibly integrate TCR clusters and signaling with ongoing motility, likely the more common way for T cells to integrate signals during their first recognition of antigens.
 A transgenic TCRα-GFP fusion demonstrates rapid internalization in the absence of stable central accumulations (cSMAC independent TCR internalization).
Representative timelapse video in vitro showing a contrast image (left), a maximum intensity projection of OT-I–GFP fluorescence (middle), and a pseudocolor image of a maximum intensity projection of OT-I–GFP fluorescence (right). Naïve OT-I–GFP T cells were incubated with antigen pulsed DCs and imaged by epifluorescence microscopy. The T cell contacts the antigen bearing DC (10ng/ml SL8), forms microclusters at the T cell-DC interface and then rapidly internalizes the TCR without forming a cSMAC. Arrows indicate internalized vesicles of TCR. Elapsed time is displayed in min:sec. Scale bar = 10um. From Friedman et al. JEM. 2010.
T-APC Synapses Visualized in vivo:
We have generated a mouse strain in which a monoclonal T cell receptor is fused to the green-fluorescent protein so that we can visualize this complex during T cell activation in vivo. This provides evidence both for the cSMAC. In the accompanying movies, the position of the APC must be surmised as they were not labeled for technical reasons.
Classical cSMAC-like accumulations with motility arrest:
 Rapid TCR clustering into a central complex during the initial stages of antigen recognition in the lymph node.
TCR clustering following antigen addition. CMTMR (red) labeled OT-I–GFP Rag2-/- cells (green) were transferred into wt recipients and recipients were immunized with CFA in the footpads. 18 hours following T cell transfer and immunization, the draining LN was explanted and visualized by two-photon microscopy following the addition of SL8 peptide antigen. The T cell shows TCR surface clustering, but initially maintains its polarized morphology. The T cell then adopts an arrested synapse morophology with rounded morphology, no motility, and TCR surface clustering. At 20 min following antigen addition, a small vesicle of internalized TCR becomes visible. The movie represents a maximum intensity Z-projection. The scale bar represents 10microns. From Friedman et al. JEM 2010.
 Surface clustering of the TCR following targeted delivery of antigen to DCs in the lymph node.
Wt mice were immunized with αDEC205:OVA + αCD40 in the footpads. 18 hours following immunization, CMTMR labeled OT-I–GFP Rag2-/- cells were transferred into the immunized recipients. 4 hours following T cell transfer, the draining popliteal LNs were explanted and visualized by two-photon microscopy. The T cell of interest forms a TCR surface cluster following the appearance of internalized TCR. All images show a single 1um medial Z-plane through the cell of interest. CMTMR (red) and OT-I–GFP (green) fluorescence are shown in the left panel, OT-I–GFP (green) fluorescence in the middle panel, and a pseudocolor representation of the OT-I–GFP fluorescence is shown in right panel. Elapsed time is displayed in min:sec. From Friedman et al. JEM 2010.
TCR Internalization, a robust indicator of signaling, without evident cSMAC formation:
 Rapid TCR clustering and internalization without cSMAC formation during the initial stages of antigen recognition in the lymph node.
TCR clustering and internalization following antigen addition. CMTMR (red) labeled OT-I–GFP Rag2-/- cells (green) were transferred into wt recipients and recipients were immunized with CFA in the footpads. 18 hours following T cell transfer and immunization, the draining LN was explanted and visualized by two-photon microscopy following the addition of SL8 peptide antigen. The T cell of interest showed reduced velocity and morphological without sustained TCR surface clustering, followed by TCR internalization. During the course of TCR internalization, the T cell maintained low level motility without morphological rounding. The movie represents a maximum intensity Z-projection. The Image was acquired using the 525/50nm green filter. The scale bar represents 10microns. From Friedman et al. JEM 2010.
Note: Some movies may not play when using the Firefox web browser. If this occurs, please use a different web browser or update your flash player.